Stop Guessing and Start Measuring with GA4 CRO
Why Guessing Is Costing You Conversions (And What to Do Instead)
Conversion rate optimization Google Analytics is the practice of using GA4’s behavioral data to systematically increase the percentage of visitors who complete a valuable action on your site — like a purchase, sign-up, or lead form submission.
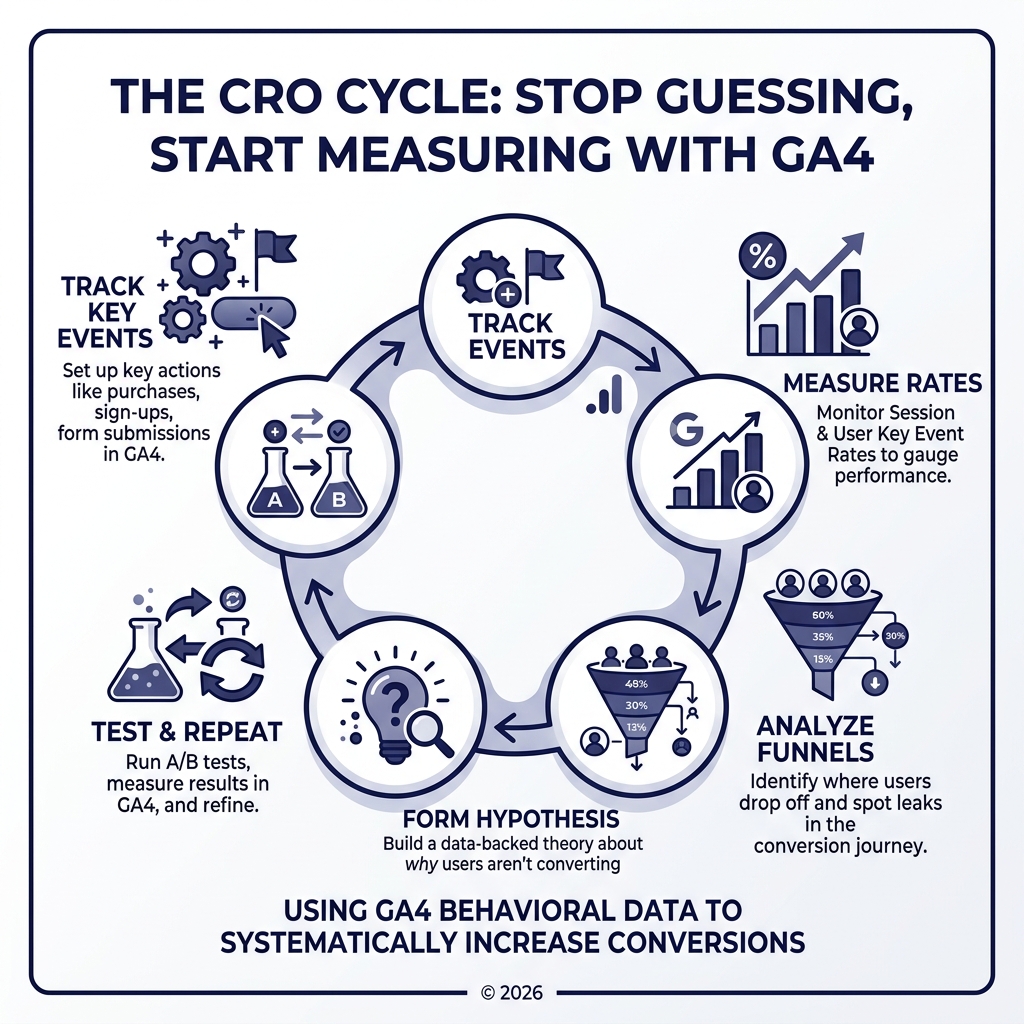
Here’s a quick breakdown of how it works:
- Track key actions — Set up Key Events in GA4 for your most important user actions (purchases, sign-ups, add-to-carts).
- Measure performance — Monitor Session and User Key Event Rates to see how often visitors convert.
- Find the leaks — Use Funnel Exploration and behavior reports to spot where users drop off.
- Form a hypothesis — Build a data-backed theory about why users aren’t converting.
- Test and improve — Run A/B tests, measure results in GA4, and repeat.
Most business owners skip straight to testing without doing the measurement work first. That’s expensive guesswork.
The truth is, your GA4 data already contains the answers. You just need to know where to look — and what questions to ask.
Nearly every analytics setup has gaps. Bounce rates under 10% often signal broken tracking. Missing Key Event toggles mean you’re measuring nothing. And averaging conversion rates across your entire site hides the pages that actually need fixing.
This guide walks you through exactly how to use GA4 to stop guessing and start growing.
I’m Trav Lubinsky — entrepreneur, brand builder, and founder of Trav Brand — and across multiple ventures and campaigns for brands like HexClad, FightCamp, and Poppi, I’ve seen how mastering conversion rate optimization Google Analytics separates the brands that scale from the ones that stall. Let’s dig in.
Conversion rate optimization google analytics word list:
Transitioning to Key Events: The New Standard for Conversion Rate Optimization Google Analytics
If you’ve been in the digital marketing game for a while, you probably remember “Goals” in Universal Analytics. Well, Google Analytics 4 (GA4) has retired that terminology in favor of Key Events. This isn’t just a name change; it’s a fundamental shift in how we measure success.
In GA4, everything is an event—a page view, a click, a scroll. To perform effective conversion rate optimization Google Analytics, we must distinguish between a casual “scroll” and a business-critical action like “generate_lead” or “purchase.” By marking specific events as Key Events, we tell Google which actions truly move the needle for our brand.
To get started, you’ll need to navigate to the Admin section of your GA4 property. Under “Data Display,” select “Events.” Here, you’ll see a list of all events currently being tracked. When you identify an event that represents a conversion—such as a form submission confirmation—simply toggle the switch to mark it as a Key Event. For a deeper dive into the technical nuances, check out the official guide on Creating and managing conversions.
This setup ensures measurement consistency. When we mark an event as a Key Event in Analytics, it becomes the “source of truth” that can be shared across other platforms, like Google Ads, ensuring that what we call a “conversion” in one place is exactly the same in the other.
Calculating Success: Session vs. User Key Event Rate
One of the most powerful upgrades in GA4 is the ability to look at conversion rates through two different lenses: the Session Key Event Rate and the User Key Event Rate. Understanding the difference is vital for accurate conversion rate optimization Google Analytics analysis.
| Metric | Calculation Formula | Best Used For… |
|---|---|---|
| Session Key Event Rate | (Sessions with Key Event / Total Sessions) * 100 | Measuring immediate campaign or landing page effectiveness. |
| User Key Event Rate | (Users with Key Event / Total Users) * 100 | Understanding long-term audience value and high-ticket sales cycles. |
As noted in the expert analysis of Conversion rate in Google Analytics 4 (2026), the Session Key Event Rate counts how many sessions resulted in at least one conversion. This is different from the old way of simply dividing total conversions by total sessions, which could lead to rates over 100% if one user converted multiple times in a single visit.
The User Key Event Rate is particularly exciting for brands with long sales cycles. If a customer visits your site five times before finally making a purchase, their User Key Event Rate remains 100% (one user, one conversion), whereas their Session Key Event Rate would be 20% (five sessions, one conversion). Depending on your business model, one of these metrics will likely be your “North Star” for optimization.
Integrating Google Ads for Cross-Platform Conversion Rate Optimization Google Analytics
To truly scale, your analytics shouldn’t live in a vacuum. By linking your GA4 property with Google Ads, you unlock a unified ecosystem for growth. This integration allows you to import your Key Events directly into Google Ads as conversion actions, ensuring your bidding strategies are optimized based on the same data you see in your reports.
A major feature to implement here is Enhanced conversions in Google Analytics. This tool uses hashed, first-party data (like an email address provided during a sign-up) to match your visitors with Google-signed-in users. This fills in the “gaps” in the user journey caused by cookie restrictions or cross-device browsing.
When these platforms are linked, your Google Ads Smart Bidding becomes much more intelligent. It can see which organic channels or referral sources assisted in a conversion, providing a holistic view of your attribution. We always recommend setting your attribution settings to “Google paid channels” or “Paid and organic channels” depending on whether you want to focus strictly on ad spend ROI or total ecosystem health.
Identifying Funnel Leaks and User Behavior Bottlenecks
Data is great, but visual data is better. In GA4, the Funnel Exploration report is your best friend for spotting where money is leaking out of your business. If you aren’t using this, you’re essentially flying blind.
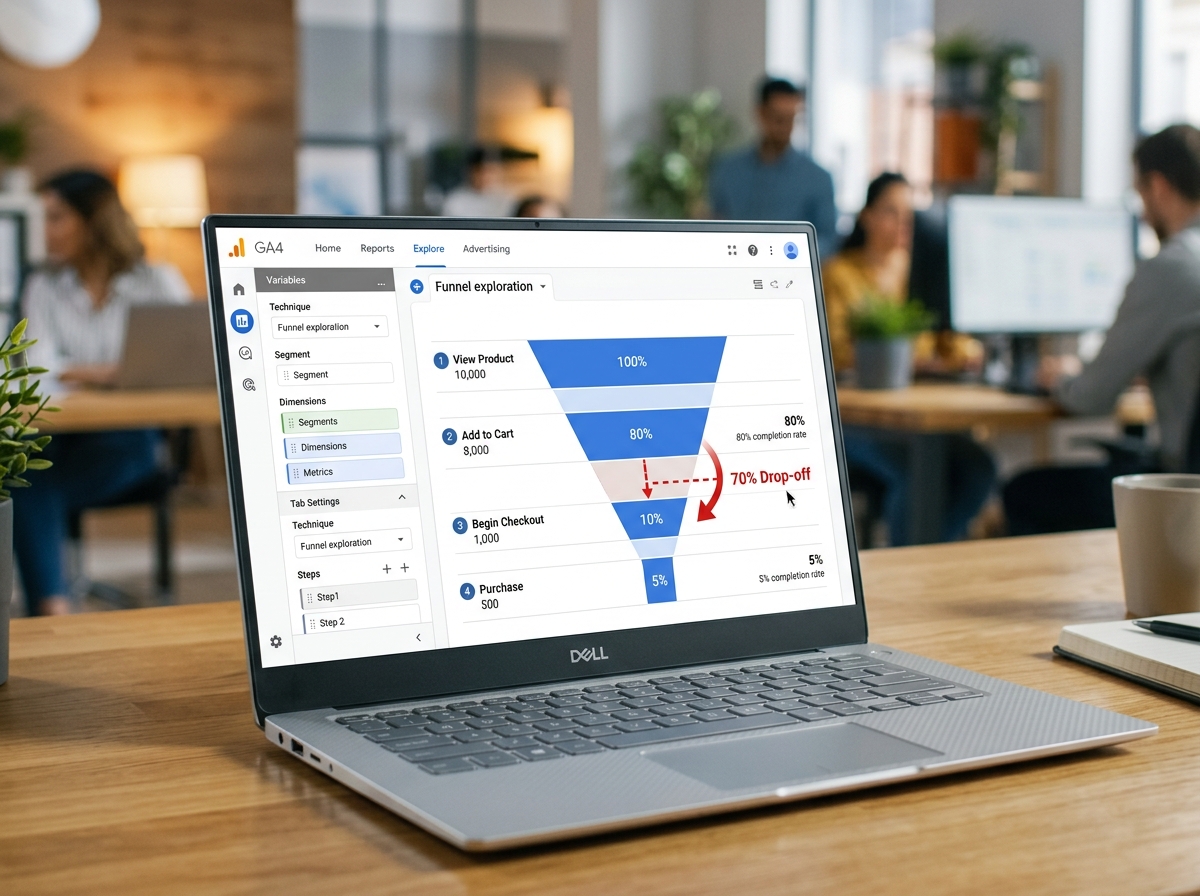
A funnel exploration allows you to map out the exact steps a user takes—for example: View Product -> Add to Cart -> Begin Checkout -> Purchase. By looking at the abandonment rates between these steps, you can pinpoint the exact moment users lose interest. Is the “Begin Checkout” button hard to find? Is the shipping cost revealed too late?
Beyond linear funnels, Path Exploration helps you understand the “wandering” user journey. Sometimes users don’t follow your intended path; they might go from a blog post to a “Contact Us” page and then leave. Mapping these journeys reveals friction points you might never have considered. For more on how to turn these insights into growth, see the Loves Data guide on Using Google Analytics for Conversion Rate Optimization.
Analyzing Engagement Metrics for Conversion Rate Optimization Google Analytics
While Key Events tell you who finished the race, engagement metrics tell you who tripped at the starting line. To master conversion rate optimization Google Analytics, you must understand the relationship between Bounce Rate, Exit Rate, and Average Engagement Time.
- Bounce Rate: In GA4, this is the percentage of sessions that were not engaged (less than 10 seconds, no key events, and only one page view). A high bounce rate on a landing page usually means a “mismatch” between what the user expected and what they saw.
- Exit Rate: This shows how often a specific page was the last one in a session. High exit rates are normal on a “Thank You” page, but they are a red flag on page two of a three-step sign-up form.
- Average Engagement Time: This is the average time the site was in the foreground of the user’s browser. If users spend five minutes on a page but don’t convert, your content is engaging, but your Call to Action (CTA) might be weak.
We recommend setting page-type benchmarks. For instance, a lead generation page might be doing well with a 30% bounce rate, while an e-commerce category page should ideally be closer to 20%. If you have high-traffic pages with high bounce rates, those are your “low-hanging fruit” for optimization.
Advanced Analysis: Traffic Sources and Qualitative Insights
Not all traffic is created equal. A “1% conversion rate” is a lie—or at least, it’s a gross oversimplification. Your conversion rate from Direct traffic (people who know your brand) will almost always be higher than traffic from a cold Pinterest ad.
By using the Traffic Acquisition report, you can segment your audiences to see which sources provide the highest quality visitors.
- Direct Traffic: Often shows high intent and brand loyalty.
- Organic Search: Reflects how well your content answers user queries.
- Referral: Can vary wildly based on the quality of the linking site.
- Paid Search: High intent, but requires tight alignment between the ad copy and the landing page.
Don’t forget to look at device-specific behavior. We often see brands where the desktop conversion rate is 4%, but mobile is 0.5%. If 80% of your traffic is on mobile, you don’t have a traffic problem; you have a mobile UX problem.
Supplementing Quantitative Data with Qualitative Methods
GA4 tells you what is happening, but it rarely tells you why. To get the full picture for conversion rate optimization Google Analytics, you need to pair your numbers with qualitative research.
Think of GA4 as the “what” and tools like session replays or heatmaps as the “why.” If GA4 shows a massive drop-off on your checkout page, a session replay might show that the “Credit Card” field is glitching on certain Android devices.
Other qualitative methods include:
- On-site surveys: Ask users who spend more than two minutes on a page, “Is there anything preventing you from checking out today?”
- Post-conversion hooks: Ask customers, “What was the one thing that almost stopped you from buying?”
- Heatmaps: See if users are clicking on elements that aren’t actually links, indicating confusion.
By identifying these barriers, you can turn a “leaky” funnel into a high-converting machine.
From Data to Action: Creating Hypotheses and Testing
Once you’ve identified a bottleneck in GA4, it’s time to act. But don’t just change things randomly—create a hypothesis.
A good CRO hypothesis looks like this: “Because we saw a 60% drop-off on the pricing page (Data), we believe that adding a ‘No Credit Card Required’ badge (Variation) will increase sign-ups (Metric) because it reduces user anxiety (Rationale).”
Now, you run an A/B test. You can use tools to split your traffic and then measure the results back in GA4. It is crucial to ensure your setup is clean before testing. Perform an implementation audit using Google Tag Manager to verify that your tags are firing correctly. If your tracking is broken, your test results are meaningless.
CRO isn’t a one-time project; it’s a cycle. You test, you learn, you measure, and you go again.
Frequently Asked Questions about GA4 CRO
What are the most common GA4 setup mistakes that hurt CRO?
The biggest killer of good data is broken tracking. This often manifests as a bounce rate under 10% (usually caused by the GA4 code being installed twice) or “dark matter” data where Key Events aren’t being tracked at all. Another common error is failing to configure cross-domain tracking, which makes a user look like they “left” your site when they moved from your blog to your checkout store. Finally, ensure you haven’t marked “non-interactive” events (like a 10-second timer) as Key Events, as this will artificially inflate your engagement metrics.
Where can I find conversion rate metrics in standard GA4 reports?
You won’t always see them by default! In the Traffic Acquisition or Landing Page reports, you often need to click the “pencil” icon to customize the report. From there, go to “Metrics” and search for Session key event rate or User key event rate. Once added and saved, these metrics will appear in your standard tables, allowing you to see exactly which pages or channels are driving the most value.
What are acceptable benchmarks for bounce and exit rates?
Benchmarks vary by industry, but here are some general rules of thumb:
- Homepages: Aim for a bounce rate below 40%.
- Lead Gen Pages: Focus on pages with a bounce rate higher than 30%.
- E-commerce Category Pages: Look for anything higher than 20%.
- Exit Rates: These are highly page-dependent. A high exit rate on a “Contact” page is fine; a high exit rate on a “Add to Cart” confirmation is a disaster. Always prioritize pages with high traffic volume. Don’t waste time optimizing a page with a 90% bounce rate if it only gets 5 visits a month. Focus on pages with at least 1,000 to 10,000 entrances for statistically significant results.
Conclusion
At Trav Brand, we believe that data is the heartbeat of every successful brand. We don’t just provide consulting; we build a complete digital ecosystem designed for strategic execution and purpose-driven growth. Whether we are scaling a household name or launching a new disruptor, our focus remains on measurable results.
Mastering conversion rate optimization Google Analytics is the difference between hoping for growth and engineering it. By setting up your Key Events correctly, analyzing your funnels for leaks, and constantly testing new hypotheses, you turn your website into a predictable revenue engine.
If you’re ready to take the guesswork out of your growth, it’s time to scale your brand with expert e-commerce strategies. Let’s stop guessing and start measuring.