The Data-Driven Guide to Content Performance Analysis
Why Content Performance Analysis is Your Growth Engine
Content performance analysis is the systematic process of measuring how well your content achieves its objectives by tracking key metrics, identifying patterns, and using data to guide future content decisions.
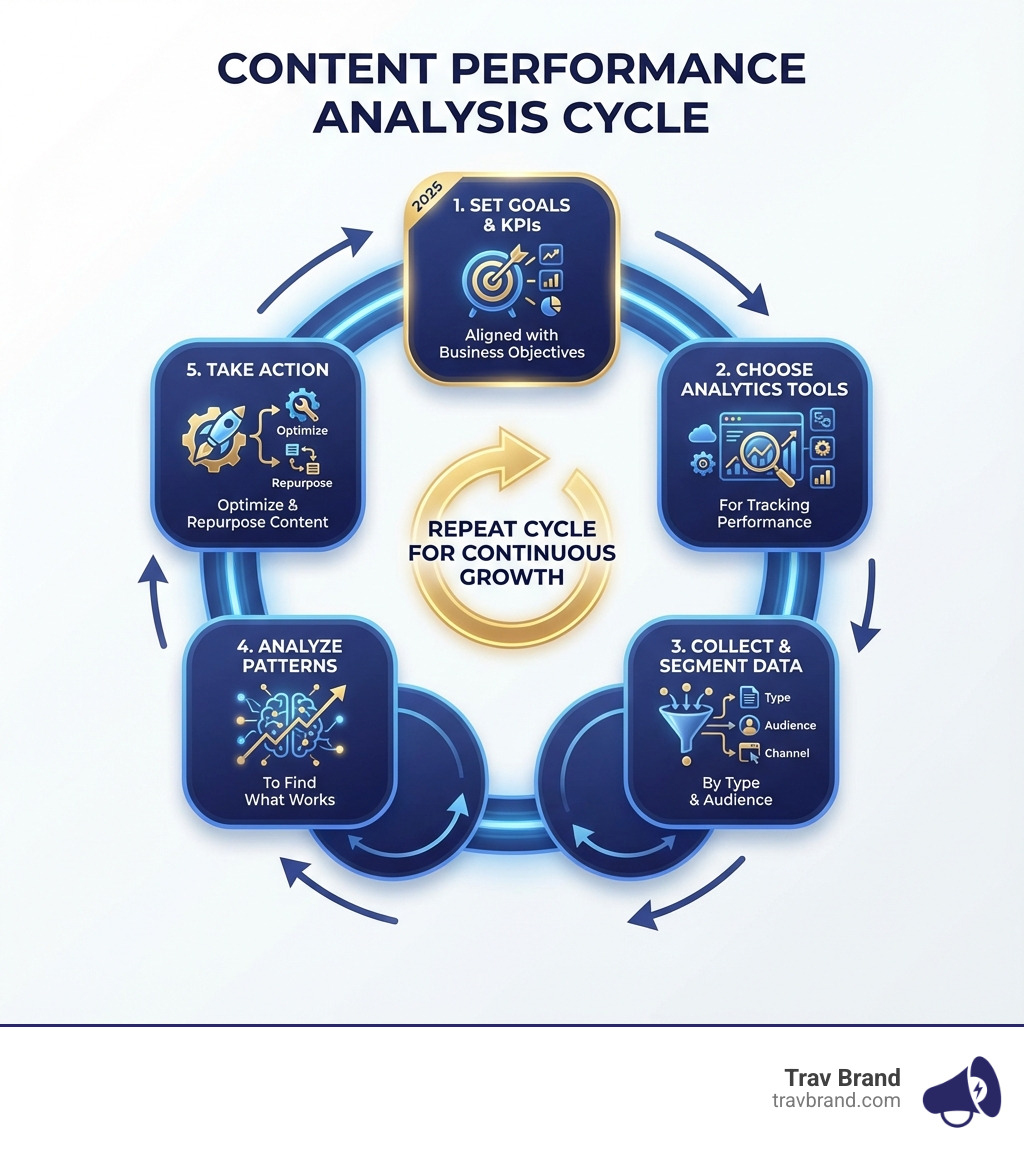
Quick Answer: Content Performance Analysis in 5 Steps
- Set clear goals and KPIs aligned with business objectives
- Choose the right analytics tools to track performance across channels
- Collect and segment data by content type, audience, and channel
- Analyze patterns to identify what works and what doesn’t
- Take action by optimizing, repurposing, or retiring content based on insights
With over 7.5 million blog posts published every day, creating content is the easy part. Understanding which content actually drives results? That’s where most businesses struggle.
Publishing without measuring is like launching a product without tracking sales. You might feel busy, but you have no idea if you’re building something valuable or just adding to the noise.
Content performance analysis transforms marketing from guesswork into a predictable system. It shows you exactly which topics resonate with your audience, which formats drive conversions, and where to invest your limited resources for maximum return.
The business impact is clear:
- Prove ROI by connecting content efforts to revenue
- Optimize spending by doubling down on what works
- Understand your audience through their actual behavior, not assumptions
- Improve faster by identifying and fixing performance gaps quickly
A strong content marketing ROI sits around 5:1 (500%), but most businesses can’t measure it because they’re tracking vanity metrics instead of business outcomes. Meanwhile, top performers are using analysis to achieve 240% increases in organic traffic and 453% growth in keyword rankings.
I’m Trav Lubinsky, and over the past decade I’ve built, scaled, and exited multiple brands by treating content as a measurable growth channel, not a creative guessing game. Throughout my work with billion-dollar enterprises and high-growth consumer brands, content performance analysis has been the foundation for every successful strategy we’ve implemented.
Key Metrics & Core Concepts to Master
Measuring content performance isn’t just about tallying numbers; it’s about understanding the story those numbers tell. It’s our secret weapon, allowing us to move beyond guesswork and truly master our website content strategy. We use the insights gained to justify our budget, align our marketing efforts with broader business goals, and deepen our understanding of what our audience truly wants.
At Trav Brand, we organize our content analysis around four key pillars: Audience Engagement, Search Performance, Conversion & Business Impact, and Brand & Distribution. This holistic view ensures we’re not just tracking vanity metrics, but focusing on what truly matters for sustainable growth.
If you want a broader background on how web analytics developed and why these metrics matter, the entry on Web analytics offers a useful overview of standard measurement concepts.
Traffic and Reach Metrics
These metrics tell us how many people are seeing our content and how they’re arriving at it. They’re foundational for understanding our content’s visibility.
- Page Views: The total number of times a page has been viewed. This helps us gauge content popularity and reach. A good benchmark for growth here is a 5% month-over-month increase in total monthly page views.
- Unique Visitors: The number of individual people who have visited our content, regardless of how many times they visited. This gives us a clearer picture of our actual audience size.
- Organic Traffic: Visitors who come to our site from search engines like Google. This is a crucial indicator of our content’s search engine optimization (SEO) effectiveness.
- Branded Searches: Queries that include our brand name. An increase here signifies growing brand awareness and direct interest in our offerings.
- Impressions: The number of times our content appeared in search results or social media feeds. This shows our potential reach, even if users didn’t click through.
- New vs. Returning Users: This distinction helps us understand if we’re attracting new audiences or building loyalty with existing ones. Both are important for different content goals.
Engagement and Behavior Metrics
Once someone lands on our content, these metrics reveal how they interact with it. Are they sticking around? Are they finding it valuable?
- Average Time on Page: How long users spend viewing a specific page. Longer times generally suggest deeper engagement and relevance.
- Bounce Rate: The percentage of visitors who leave our site after viewing only one page. A bounce rate of 40% or lower is considered good, indicating our content is relevant and engaging enough to encourage further interaction.
- Scroll Depth: This measures how far down users scroll on a web page. A good scroll depth typically ranges between 60-80%, showing that users are consuming a significant portion of our content.
- Social Shares: The number of times our content is shared on social media platforms. High shares indicate our content resonates and encourages distribution. Blog posts, for instance, typically see a social share rate of 5–15%.
- Comments: The number of comments our content receives. This is a strong indicator of audience engagement and community building.
Conversion and ROI Metrics
Our content needs to contribute to our business goals. These metrics connect content directly to our bottom line.
- Conversion Rate: The percentage of visitors who complete a desired action, such as signing up for a newsletter, downloading an asset, or making a purchase. For most content marketing, the conversion rate will fall between 1.5-3%.
- Leads Generated: The number of potential customers identified through our content (e.g., form submissions, demo requests). This is a direct measure of our content’s lead generation power.
- Cost Per Acquisition (CPA): The cost of acquiring a new customer through our content marketing efforts. Lower CPA means more efficient spending.
- Customer Lifetime Value (CLV): The total revenue a business expects to generate from a customer over their relationship. Content that attracts high-CLV customers is invaluable.
- Calculating ROI: The ultimate measure of our content’s financial impact. The formula is: (Net Profit / Total Investment Cost) x 100%. A marketing ROI of 5:1 or 500% is considered strong, while anything below 2:1 or 200% indicates poor performance. We’ve seen how an SEO-focused content strategy can increase total organic sessions by 240% and top 10 keywords by 453%, directly impacting ROI.
SEO and Authority Metrics
These metrics show how well our content is optimized for search engines and how authoritative it is perceived to be online.
- Keyword Rankings: Our content’s position in search results for specific keywords. Higher rankings mean more visibility.
- Backlinks: Links from other reputable websites pointing to our content. These are a strong signal of authority and trust to search engines.
- Domain Authority: A search engine ranking score that predicts how likely a website is to rank on search engine result pages (SERPs). Higher authority generally means better ranking potential.
- AI Visibility: A newer, but increasingly critical metric. This measures how prominently our content appears in AI-generated search results and AI tools. The rise of AI search is already having a significant impact; for example, Wikipedia has seen an 8% traffic decrease from this time in 2024, which they attribute largely to AI search. We need to adapt our strategy to ensure our content is visible in these evolving search landscapes.
- SERP Click-Through Rate (CTR): The percentage of users who click on our content when it appears in search results. A strong CTR indicates compelling titles and meta descriptions.
Here’s a list of essential SEO metrics we track:
- Organic Traffic
- Keyword Rankings
- AI Visibility
- Branded Searches
- Brand Mentions
- Impressions
- Clicks
- Backlinks
A Step-by-Step Guide to Content Performance Analysis
Content performance analysis isn’t a one-time event; it’s a continuous cycle, a repeatable framework that moves us from raw data points to strategic direction. It’s how we master our website content strategy and stop leaving our results to chance.

Step 1: Set Clear Goals and KPIs
Before we even look at a single data point, we define what success looks like. This means aligning our content objectives with our broader business goals. Are we aiming for brand awareness, lead generation, customer retention, or direct sales?
- Aligning with business objectives: Every piece of content, from a blog post to a social media update, should serve a clear business purpose. Without this alignment, we risk creating content that’s engaging but doesn’t move the needle.
- SMART goals: We set Specific, Measurable, Achievable, Relevant, and Time-bound goals. For example, instead of “increase traffic,” we aim for “achieve a 30% increase in organic website traffic during the next quarter” or “generate a monthly influx of 500 new leads through content downloads.”
- Choosing metrics that matter: Based on our goals, we select the key performance indicators (KPIs) that will tell us if we’re on track. For awareness content, organic traffic and time on page might be key. For lead generation, conversion rates and leads generated are paramount. It’s easy to get lost in vanity metrics (like just page views); we focus on those that directly inform our strategy.
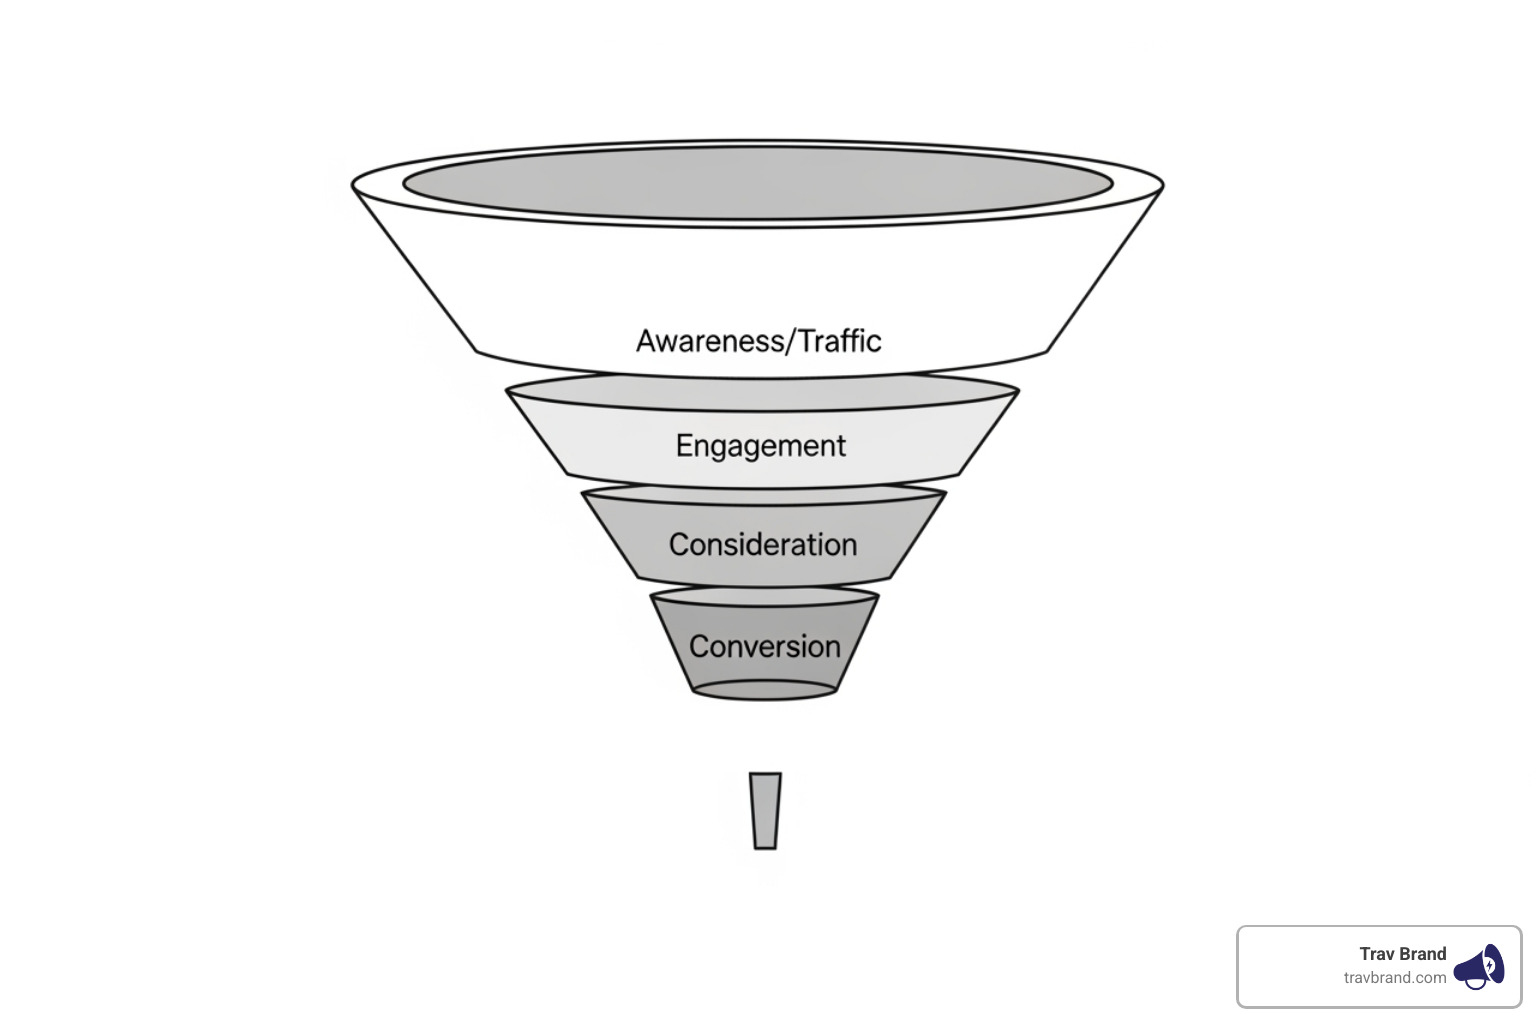
- Top-of-funnel vs. bottom-of-funnel goals: Content serves different purposes at various stages of the customer journey. Top-of-funnel content might aim for high reach and engagement, while bottom-of-funnel content focuses on conversions and sales. Our KPIs reflect these distinct objectives.
Step 2: Choose Your Analysis Toolkit
The right tools are essential for collecting and analyzing performance data efficiently. While we avoid mentioning specific competitor products, know the types of tools that form a robust content analysis toolkit.
- Foundational tools: These are the bedrock of our data collection. They provide insights into website traffic, user behavior, and how our content performs in search. Think of them as our digital eyes and ears.
- Analytics and reporting platforms: These systems help us track key metrics, visualize trends, and generate comprehensive reports. They allow us to see how visitors are engaging with our website, individual pages, and blog posts.
- Search performance tools: These specialized tools offer valuable data on keyword rankings, backlinks, and even competitive analysis, showing us what keywords our rivals rank for and where their backlinks are coming from. This information is gold for spotting gaps in our strategy and uncovering new content opportunities.
- Behavior analytics: Tools in this category give us a visual map of user engagement. They generate heatmaps showing where people click, scroll, and linger, offering priceless insights into how they actually interact with our page design and content layout.
- Centralizing data: As our content scales across various platforms (website, social media, email), integrating data from multiple sources into a single view becomes crucial. This allows us to automate multi-channel reporting, saving time, reducing errors, and making more effective data-driven decisions.
Step 3: Collect, Segment, and Analyze Data
With our goals set and tools in place, the real fun begins: diving into the data!
- Data collection process: We gather data from all our content channels – website analytics, social media insights, email marketing platforms, and CRM systems. We ensure consistent tracking parameters (like UTM codes) are used to accurately attribute performance.
- Audience segmentation: Not all visitors are the same. We segment our audience by demographics, behavior (e.g., new vs. returning, engaged vs. bounced), traffic source, or customer stage. Analyzing how different segments respond to content helps us create more targeted and effective pieces.
- Channel performance: We assess how content performs on each platform. A video that tanks on our blog might soar on social media, and vice-versa. This helps us understand optimal content distribution strategies.
- Content type analysis: We evaluate performance by content format – blog posts, videos, infographics, case studies, landing pages. This reveals which formats resonate most with our audience for different purposes.
- Identifying patterns and outliers: We look for trends over time, sudden spikes or drops in performance, and content pieces that significantly outperform or underperform others. These anomalies often hold the most valuable insights for optimization. For example, we might find that “how-to” guides generate significantly more qualified leads than industry news, leading us to restructure our content calendar.
Step 4: Report Insights and Visualize Performance
Analyzing data is only useful if we can translate it into actionable insights and communicate them effectively.
- Creating dashboards: We build custom dashboards that highlight our key KPIs and present data visually. This allows for quick, at-a-glance performance checks. These dashboards can show us how visitors are engaging with our website, individual pages, or blog posts.
- Communicating findings to stakeholders: We distill complex data into clear, concise reports that answer critical business questions. Our reports focus on “what happened,” “why it happened,” and “what we should do next.”
- Using visualization tools: Charts, graphs, and heatmaps make data easier to understand and more impactful. For example, using a tool that allows us to see how visitors are engaging with our website, individual pages, or blog posts can transform our understanding.
- Report templates and best practices: We leverage pre-made report templates, which often come with our analytics tools, or create our own custom reports. These templates come with pre-configured charts, tables, and filters, helping us get up and running quickly without needing a complex setup. We can customize them by applying filters, adding secondary dimensions, and modifying metrics to tailor them to our specific needs.
Turning Data into Action: How to Improve Your Content Strategy
This is where the magic happens! Content performance analysis is not just about understanding; it’s about doing. It’s how we close the loop, ensuring continuous improvement and making data-driven decisions for our content calendar.
Refresh and Update Underperforming Content
Not all content is evergreen. Some pieces, despite initial success, may start to “decay” over time due to outdated information, broken links, or shifting search trends.
- Identifying “decaying” content: We regularly audit our content for pieces with declining traffic, high bounce rates, or low engagement.
- Updating statistics and information: We ensure our content is always current and accurate. This might mean refreshing data points, adding new insights, or revising recommendations.
- Improving on-page SEO: We re-optimize titles, meta descriptions, headings, and integrate new relevant keywords. We also add internal links to newer, related content, boosting our overall site authority.
- Adding new visuals or media: Sometimes, a stale piece just needs a facelift. Incorporating fresh images, infographics, or embedding videos can significantly increase engagement and time on page. We’veseen how updating content can lead to results like the Alexander Orthopaedics case, where an SEO-focused content strategy increased total organic sessions by 240% and top 10 keywords by 453%.
Repurpose and Amplify Top-Performing Content
Why let a great idea live in just one format? Our top-performing content is a goldmine for repurposing and amplification.
- Turning blog posts into videos or infographics: A popular blog post can become a compelling video script, a detailed infographic, or an engaging podcast episode. Video, in particular, is highly effective; for example, 79% of Shopify’s traffic comes from mobile, where video content thrives.
- Creating social media carousels from guides: We break down comprehensive guides into bite-sized, shareable content for platforms like Instagram or LinkedIn. Take a page from Heidi Somers from Buff Bunny, who turned social storytelling into a main acquisition engine.
- Expanding articles into ebooks: A series of related blog posts can be compiled and expanded into a valuable ebook or whitepaper, serving as a lead magnet.
- Cross-channel promotion: We actively promote our repurposed content across all relevant channels, ensuring maximum reach and impact. A single blog drawing over 8,000 views per month can be amplified even further.
The Future of Measurement: AI and Personalization
The digital landscape is constantly evolving, and so too are the tools and strategies for content performance analysis. AI and personalization are at the forefront of this evolution.
- Impact of AI search on traffic: AI-powered search experiences (like AI Overviews) are changing how users find information. This has already led to significant shifts in organic traffic, as seen with Wikipedia’s 8% traffic decrease from AI search. We’re adapting by focusing on content quality, authority, and optimizing for AI-generated summaries.
- Tracking AI visibility: New metrics are emerging to track how prominently our content appears in AI-generated results and AI tools. We’re learning to measure not just human clicks, but AI’s “attention” to our content.
- Measuring personalization effectiveness: As AI enables hyper-personalization, our content can be dynamically custom to individual user behavior. We measure the effectiveness of this by tracking engagement rates, conversion rates, and retention among users who receive personalized content.
- Adapting to evolving search technology: This means staying agile, experimenting with new content formats that AI favors, and ensuring our content is structured in a way that AI models can easily understand and synthesize. AI and machine learning will increasingly automate data collection and analysis, allowing predictive analytics to forecast content performance and real-time analytics to enable quicker adjustments.
Frequently Asked Questions about Content Analysis
What is the difference between a content audit and a content performance analysis?
While both are crucial for content strategy, they serve distinct purposes.
| Feature | Content Audit | Content Performance Analysis |
|---|---|---|
| Primary Goal | Inventory, quality assessment, strategic alignment | Measurement of effectiveness, impact, and ROI |
| Focus | All existing content (qualitative review) | Specific content pieces/campaigns (quantitative metrics) |
| Nature | Project-based, clean-up, reinvention | Ongoing process, refinement, optimization |
| Frequency | Less frequent (annually, before major shifts) | More frequent (weekly, monthly, quarterly) |
| Key Questions | Is this content accurate, relevant, on-brand? | Is this content achieving its goals (traffic, leads, sales)? |
A content audit is like taking stock of everything in your pantry and deciding what to keep, throw out, or buy more of. Content performance analysis is like tasting your sauce while you cook and adjusting the seasoning. One is a foundational review, the other is continuous optimization.
How often should I analyze my content’s performance?
The frequency of your content performance analysis depends on your goals and the speed of your content production. We recommend a tiered approach:
- Monthly for high-level trends: A monthly review allows us to spot overall trends, identify top and bottom performers, and make high-level adjustments to our content calendar.
- Quarterly for deep-dives and strategy: Every quarter, we conduct a more thorough analysis to evaluate strategic effectiveness, identify major opportunities, and inform budget allocation. This is where we make significant decisions about content pillars or new initiatives.
- Weekly for active campaigns: For high-stakes campaigns, new product launches, or A/B tests, weekly (or even daily) check-ins are crucial for real-time optimization. This allows us to quickly pivot if something isn’t working or double down on unexpected successes.
- For new content: For statistical significance, aim for at least 100 data points per content type or segment you’re analyzing. For newer content, we track performance for at least 30 days before drawing conclusions, as some content (especially SEO-focused pieces) can take time to gain traction.
How do I accurately measure content marketing ROI?
Accurately measuring content marketing ROI requires a meticulous approach that tracks the entire customer journey and accounts for all associated costs.
- Tracking the full customer journey: We implement robust tracking to follow users from their first interaction with our content to their final conversion. This often involves using analytics tools and marketing automation platforms.
- Using campaign tracking parameters: We use UTM parameters on all our content links to clearly identify traffic sources and campaigns, allowing us to attribute specific actions back to individual content pieces.
- Attributing revenue to specific content: This is often the trickiest part. We use attribution models (e.g., first-touch, last-touch, linear, time decay) to understand how different content pieces contribute to conversions throughout the sales funnel. For instance, a blog post might be a “first touch” that introduces a prospect, while a case study is the “last touch” before a demo request.
- Factoring in all costs (creation, promotion, tools): To calculate true ROI, we must include not just the cost of content creation (writers, designers, video production) but also promotion (paid ads, social media boosts), the tools we use (analytics platforms, SEO software), and the time investment of our team. Only then can we use the formula: ROI = (Net Profit / Total Investment Cost) x 100%.
Conclusion: Build a Smarter Content Engine
In the vast expanse of the digital field, content is indeed king, but only if its reign is measured, optimized, and relentlessly focused on driving results. We’ve seen how a data-driven approach to content performance analysis transforms content marketing from a creative gamble into a predictable growth engine.
By embracing key metrics across traffic, engagement, conversion, and SEO, and by following a structured analysis process, we can move beyond guesswork. We can identify what truly resonates with our audience, justify our investments, and continuously refine our strategy for maximum impact. From refreshing underperforming pieces to repurposing our greatest hits, and adapting to the evolving landscape of AI and personalization, continuous analysis is the bedrock of content excellence.
At Trav Brand, we believe in building and scaling brands not just through compelling content, but through measurable, data-backed content strategies that deliver tangible ROI. We turn insights into action, ensuring every piece of content works smarter, not just harder, for your business.
Ready to open up the full potential of your content and build a smarter content engine? Learn more about our digital marketing services and find how we can help you turn your content into your most powerful growth driver.