Effective Strategies for Optimizing Your Customer Journey
Why Conversion Funnel Analysis Is the Key to Growing Your Revenue
Conversion funnel analysis is the process of examining each step a potential customer takes — from first discovering your brand to making a purchase — so you can find exactly where people drop off and fix it.
Here’s a quick breakdown of what it covers:
- What it is: Tracking user movement through stages like awareness, interest, evaluation, action, and retention
- Why it matters: Identifies where you’re losing customers and why
- What you can do with it: Make targeted, data-driven changes that lift conversions at each stage
- Who it’s for: Founders, marketers, and product teams who want more revenue from their existing traffic
Most businesses focus on getting more traffic. But the real problem is often what happens after people land on your site.
Consider this: for every 1,000 people who visit a homepage, roughly 46 will actually make a purchase. That’s a 4.6% conversion rate — and over 70% of shoppers who add something to their cart will abandon it before buying. Those aren’t traffic problems. They’re funnel problems.
The good news? Once you can see where people leave, you can fix it systematically.
I’m Trav Lubinsky — entrepreneur, investor, and founder of Trav Brand — and I’ve applied conversion funnel analysis across consumer products, e-commerce, and high-growth brands like HexClad, FightCamp, and Poppi to turn leaky funnels into reliable revenue engines. Let’s walk through exactly how to do the same for your business.
The Core Components of Conversion Funnel Analysis
To fix a leaky pipe, you first have to know where the water flows. In marketing, we use the “funnel” metaphor because, naturally, you start with a wide pool of people at the top and end up with a smaller, more concentrated group of customers at the bottom. Conversion funnel analysis is our way of measuring the velocity and volume of that flow.

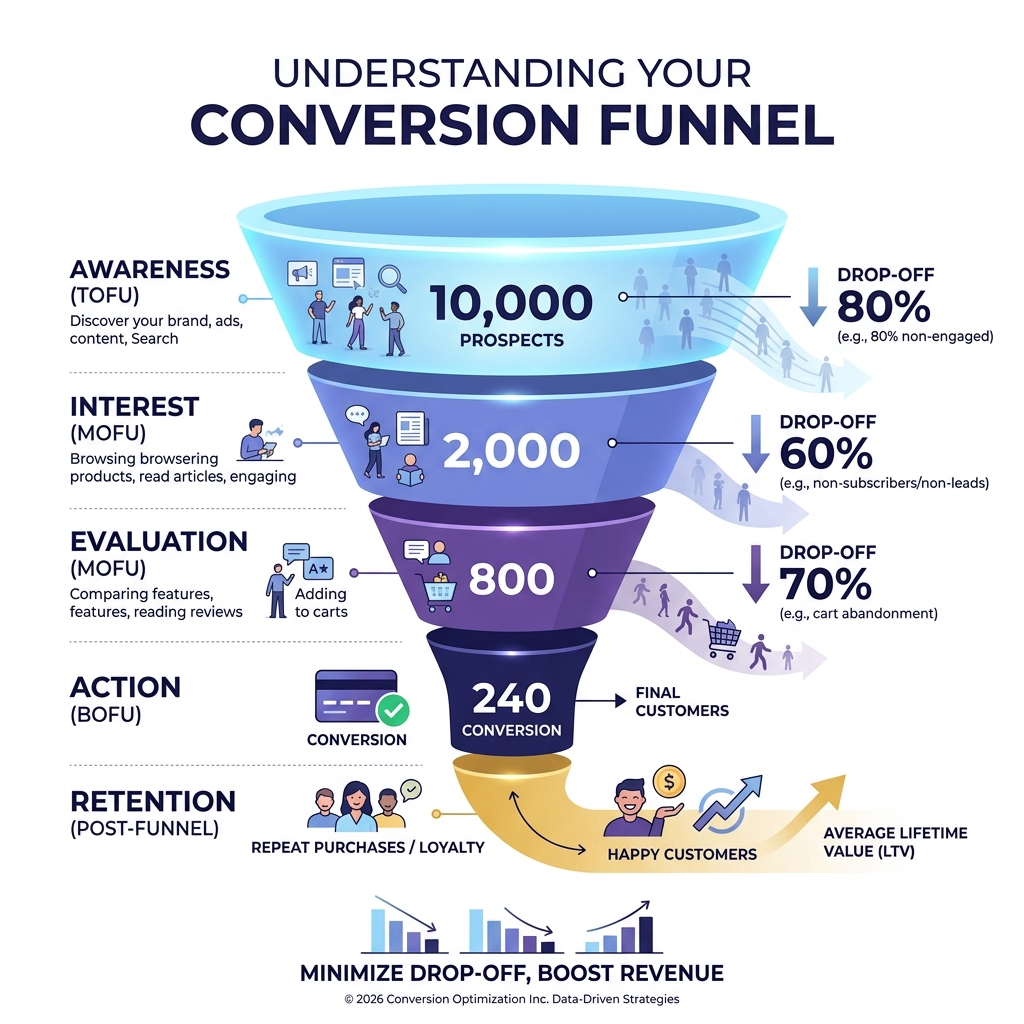
Every successful journey typically moves through these five core stages:
- Awareness Stage: This is the “handshake.” It’s the first time a user encounters your brand, whether through a social media ad, a Google search, or a word-of-mouth recommendation. At this stage, our goal is simply to be seen and remembered.
- Interest Stage: Now they’re browsing. They might read a blog post, watch a product video, or sign up for a newsletter. They know they have a problem, and they think we might have the solution.
- Evaluation Stage: This is the “comparison” phase. Users are looking at reviews, checking out competitors, and weighing the pros and cons. They are looking for reasons to trust us over someone else.
- Action Stage: The moment of truth. This is the purchase, the subscription, or the contract signing. In eCommerce, this often involves the journey from “Add to Cart” to “Thank You” page.
- Retention Stage: Often overlooked but incredibly vital. This is where we turn a one-time buyer into a brand advocate. It’s about product adoption, loyalty programs, and repeat purchases.
As highlighted in this guide to funnel analysis, understanding these stages allows us to stop guessing and start measuring. If 90% of your visitors leave at the “Interest” stage, you don’t have a checkout problem—you have a messaging or engagement problem.
A Step-by-Step Guide to Analyzing Your Funnel
We don’t just want to look at a single “Conversion Rate” number. That’s like looking at your car’s “Check Engine” light; it tells you something is wrong, but it doesn’t tell you if you’re out of oil or if the transmission is blown. We need a structured workflow to diagnose the engine.
1. Customer Mapping & Touchpoint Identification
We start by defining the “happy path”—the ideal sequence of steps we want a user to take. We list every touchpoint, from the initial ad click to the final confirmation email. For an eCommerce brand, this might look like: Homepage > Collection Page > Product Page > Cart > Checkout > Purchase.
2. Identifying Friction Points
Once the map is drawn, we look for the “cliffs.” These are the steps where the largest percentage of users drop off. For example, if nearly 30% of people leave after viewing their cart but before entering personal details, that’s a massive friction point. Is the shipping cost too high? Is the form too long? This is where we focus our energy.
3. User Segmentation
Averages are lazy; they hide the most interesting data. We always segment our funnels to see how different groups behave. You might find that mobile users convert 74% lower than desktop users, or that visitors from Instagram are far more likely to buy than those from a cold Google search. By breaking the data down by device, traffic source, or even geographic location, we can tailor our fixes to specific problems.
Setting Up Tracking for Conversion Funnel Analysis
You cannot analyze what you do not measure. Proper instrumentation is the backbone of conversion funnel analysis. We look at two types of conversions:
- Macro-conversions: The big goals, like a completed sale or a signed contract.
- Micro-conversions: The smaller steps that lead to the big goal, such as clicking a “Size Guide,” watching 30 seconds of a video, or adding an item to a wishlist.
As noted in this Shopify guide on funnel analysis, ensuring your events are properly instrumented—meaning every button click and page view is accurately recorded—is the first step. Without clean data, you’re just making expensive guesses. We verify that our identity stitching is correct (tracking the same user across mobile and desktop) so we don’t count one person as two different “lost” users.
Interpreting Data from Your Conversion Funnel Analysis
When we look at the dashboard, we aren’t just looking for high numbers; we’re looking for patterns.
- Drop-off Rates: This is the percentage of users who do not move from one step to the next. While a 70% cart abandonment rate is common in eCommerce, a 40% drop-off at the final payment screen is a crisis that usually points to a technical bug or a lack of trust.
- Funnel Velocity: How long does it take for a user to move from Awareness to Action? In SaaS, this is often called “Time to Value.” If it takes three weeks for a trial user to reach “activation,” we need to find ways to shorten that journey.
- Conversion Window: We must set a realistic time frame for analysis. A person buying a $20 t-shirt might convert in 10 minutes, but a B2B buyer might take 11 months.
According to research on finding funnel drop-offs, the most successful brands don’t just fix the biggest drop-off; they fix the most “decisionable” one—the point where a small change in copy or design can lead to the biggest lift in revenue.
Strategies to Optimize Each Stage of the Customer Journey
Once the analysis is complete, it’s time to execute. We use different levers depending on which part of the funnel is “bleeding.”
| Funnel Stage | eCommerce Strategy | SaaS Strategy |
|---|---|---|
| Awareness (TOFU) | Social ads, Influencer content | SEO blogs, Whitepapers, Webinars |
| Interest (MOFU) | Product videos, “Welcome Mat” PDPs | Case studies, Free tools, Newsletters |
| Evaluation (MOFU) | Reviews, Comparison charts | Product demos, Comparison pages |
| Action (BOFU) | One-click checkout, Abandoned cart emails | Free trial, Discounted annual billing |
| Retention | Loyalty points, Subscription models | Onboarding flows, Feature updates |
Top-of-Funnel (TOFU): Building Awareness
At the top, we focus on education. If we’re selling a new type of cookware, our TOFU content might be a blog post on “Why Non-Toxic Pans Matter.” We aren’t asking for the sale yet; we’re building the foundation of trust.
Middle-of-Funnel (MOFU): Nurturing Interest
This is where we address objections. We use social proof like testimonials and expert reviews. In the evaluation stage, we might use “Welcome Mats”—hero sections on product pages that align perfectly with the ad the user just clicked—to ensure a cohesive experience.
Bottom-of-Funnel (BOFU): Driving Action
Here, we use urgency and simplicity. Limited-time offers, “low stock” alerts, and free shipping counters can provide the final nudge. Most importantly, we simplify the checkout. Every extra form field is another chance for a customer to change their mind.
A/B Testing & Hypothesis Testing
We don’t change things just because we “feel” like it. We form a hypothesis: “If we move the shipping information higher up the page, then cart abandonment will decrease because users will have more price transparency.” Then, we test it. We look for at least a 10% improvement over two weeks to ensure the results are statistically significant.
Key Metrics and Tools for Funnel Success
To keep our funnel healthy, we monitor a specific set of KPIs that go beyond the basic conversion rate.
- Cost Per Acquisition (CPA): How much are we spending to get one customer? If your CPA is higher than your initial profit margin, your funnel needs to work harder on the back end.
- Customer Lifetime Value (LTV): The total revenue a customer generates over their entire relationship with us. A high-performing funnel turns a $50 buyer into a $500 lifetime customer.
- Average Order Value (AOV): By using “frequently bought together” bundles or post-purchase upsells, we can increase the value of every conversion.
- Revenue at Risk: We calculate this by multiplying the number of visitors by the drop-off rate and the AOV. This helps us prioritize which “hole” in the funnel to plug first based on actual dollars lost.
Our Recommended Toolkit
We utilize a mix of quantitative and qualitative tools to get the full picture:
- Analytics Platforms: Google Analytics 4 (GA4) or Mixpanel for tracking the “what.”
- Session Recordings: Tools like Hotjar or Microsoft Clarity to see the “why.” Watching a user “rage click” a broken button tells us more than a spreadsheet ever could.
- Heatmap Software: To see where users are looking and where they are ignoring your CTAs.
- User Feedback Loops: Post-purchase surveys and customer interviews are gold mines for discovering hidden barriers to purchase.
Frequently Asked Questions about Funnel Optimization
What is a good conversion rate for my industry?
While it varies, the standard eCommerce benchmark is around 2%. For SaaS, a free-trial-to-paid conversion rate of 17% is considered strong. However, don’t obsess over industry averages—focus on beating your own historical data.
How often should I perform a funnel analysis?
We recommend a deep dive every two weeks to two months, depending on your traffic volume. If you’re running high-spend paid campaigns, you should be monitoring your primary funnel daily for any sudden “cliffs” in performance.
What is the difference between a marketing funnel and a sales funnel?
The marketing funnel is responsible for generating and nurturing leads until they become Marketing Qualified Leads (MQLs). The sales funnel takes those MQLs and converts them into Sales Qualified Leads (SQLs) and, ultimately, paying customers. In modern digital brands, these two often overlap into one seamless customer journey.
Conclusion
At Trav Brand, we believe that traffic without conversion is just expensive window shopping. You don’t need more people looking at your site; you need more of the people already there to take action.
Conversion funnel analysis isn’t a one-time project; it’s a continuous process of refinement. By mapping the journey, identifying the friction, and testing your way to better results, you can turn your digital presence into a high-performance engine for growth. We focus on the complete ecosystem—from the initial strategy to the final execution—ensuring that every dollar you spend on marketing works harder for your bottom line.
Are you ready to see where your brand is leaving money on the table? Let’s stop the guesswork and start scaling with measurable results.
More info about brand audit services